Information Visualization MOOC Flashcards app for iPhone and iPad
Developer: Studio Cypher
First release : 30 Dec 2015
App size: 132.64 Mb
Embrace the power of information visualization and render data into actionable insights.
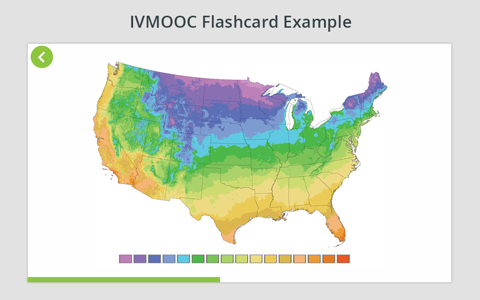
These flashcards show more than 50 visualizations taught in the Information Visualization MOOC (IVMOOC) at Indiana University. Learn the names, types, and properties of these visualizations to use them effectively.
Register for the IVMOOC at http://ivmooc.cns.iu.edu to gain access to tools, instructions, and part 2 of the Atlas of Knowledge (The MIT Press, 2015), which presents a theoretically grounded and practically useful visualization framework that empowers anyone to render data into insights.
In the information age, being able to “read and write” information visualizations is becoming as important as being able to read and write text. Embrace the power of effective and aesthetically pleasing data visualizations and enjoy making your very own visualizations.


